You’ve probably heard the headlines. Programmers were laid off. Junior developers can’t find work. Tech companies are freezing hiring because one AI tool can now do the work of a dozen entry-level engineers. The conversation is loud, anxious, and, according to a new study from MIT, almost entirely focused on the wrong thing.
I recently watched a video by Economics Explained that clearly broke down this research, and it reframed how I think about AI’s real effect on the economy. Most of the discourse treats AI as something that replaces jobs. But that’s not really how it works. More often, AI replaces the tasks inside them. A lawyer doesn’t disappear overnight, but the hours spent reviewing routine contracts quietly shrink. A journalist keeps writing, but research time starts to compress. Sounds like a softer version of the same story? It definitely isn’t.
Our entire economic system was built to count jobs and people, not to look inside a job and ask which parts of it AI can already technically perform.
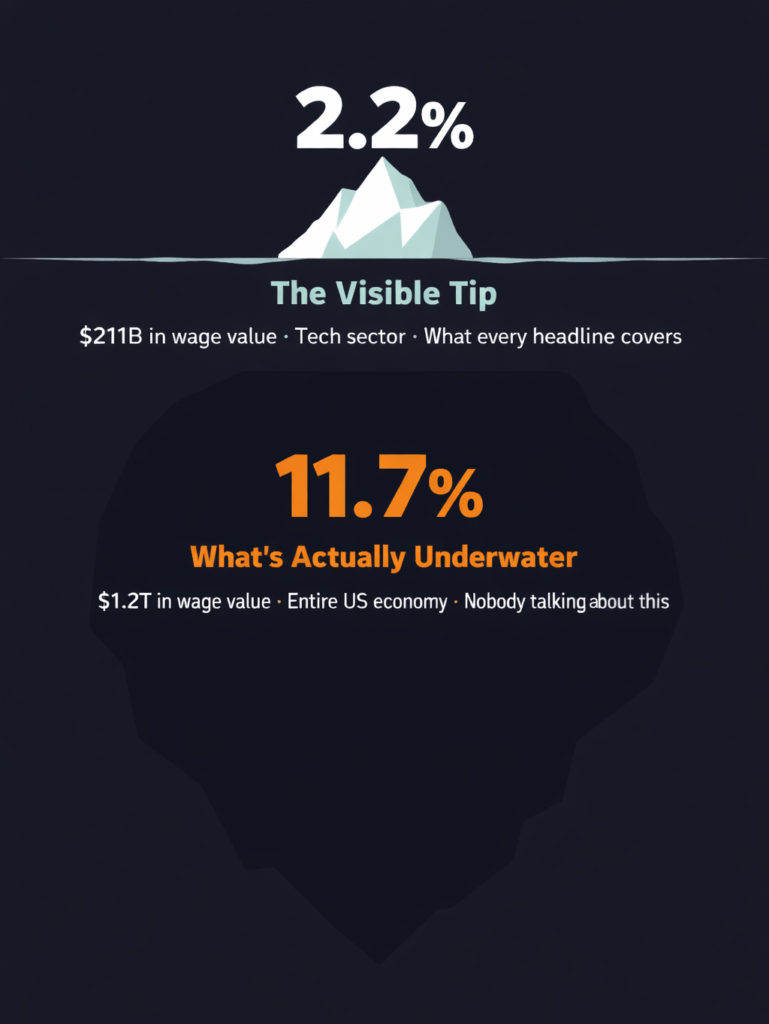
That’s the core problem MIT set out to solve. They didn’t build another prediction of which jobs will disappear. They built something more useful: an actual map of where AI capabilities and human skills currently overlap, weighted by the economic value of that work. They called it the Iceberg Index.
The Tip of the Iceberg, and What's Underwater
The visible part of the AI-disruption story, the one getting all the headlines, is tech. In 2025 alone, more than 100,000 job losses were linked to AI restructuring. When you measure the wage value of tech work that AI can technically perform, it comes to about 2.2% of the total US labor market, roughly $211 billion.
The same capabilities that make a coding assistant useful to a software engineer, document processing, routine analysis, and data handling, don’t belong just to tech. They show up across hundreds of occupations that would never appear in an AI-layoffs headline. Financial analysts. HR coordinators. Insurance claims processors. Legal secretaries.
When you apply the methodology to the whole economy, the number jumps from 2.2% to 11.7%, roughly $1.2 trillion in wage value. Five times larger.
The anxiety about AI that has dominated headlines for two years has focused on roughly one-fifth of the actual problem. The other four-fifths have been sitting on a fault line that no government, no company, and no individual worker has been actively preparing for.
Who Is Actually Most Exposed?
Here’s where it gets strange. If you had to guess which states are sitting on the biggest fault lines, you’d probably say California, Washington, New York. You’d be wrong.
According to the Iceberg Index, South Dakota, North Carolina, and Utah show higher exposure values than California or Virginia. Their economies are heavily concentrated in administrative and financial work, exactly the skills sitting in the gap between what AI can technically do and what it’s currently doing in practice.
Tennessee’s tech sector exposure is 1.3%, nothing that would trigger alarm bells in any standard workforce planning model. But its Iceberg Index is 11.6%. The white-collar workforce keeping Tennessee’s factories running is 10 times more exposed than the tech sector everyone has been watching.
And it’s not just geography that surprises. A separate Anthropic study on labor market impacts found that workers in the most exposed occupations tend to be more educated, higher-paid, and more likely to be female than those in the least exposed occupations. As Economics Explained put it in his breakdown of this research, the people most exposed aren’t the ones who fell behind. They’re the ones who did everything society told them to do.
The people most exposed to AI displacement are the ones who did everything society told them to do, and did it well.
The Gap Between "Can" and "Is"
Before this gets too dark, there’s an important distinction the MIT study makes: it measures technical capability, not outcomes. The Iceberg Index is an earthquake risk map, not a weather forecast. It tells you which buildings are sitting on a fault line, not if or when the tremor will hit.
The gap between capability and actual use is significant. Anthropic’s labor market research found that for computer and math workers, AI is theoretically capable of handling around 94% of their tasks, but in observed professional use, it’s currently covering about 33%. That gap exists because of regulation, integration challenges, and the simple fact that most organizations still require a human to check AI’s work.
What AI can theoretically do in computer & math occupations
What AI is actually doing today in those same roles
These are friction points that may resolve themselves as technology matures. And the leading edge is already visible: the MIT paper notes a 13% relative decline in early-career employment (ages 22-25) in AI-exposed occupations. Entry-level job postings have also shifted noticeably since 2023, with demand concentrating on experienced roles. Job postings fall before employment does.
A Warning for Workers AI Can't Touch
Here’s a wrinkle Economics Explained raises in his video that I think deserves its own moment. What about the roughly 30% of workers with essentially zero AI exposure? Cooks, plumbers, nurses, childcare workers, bartenders. People doing physical, hands-on, relational work that no language model can replicate. Surely they’re fine?
Not exactly. There’s a well-documented economic pattern called Baumol’s Cost Disease, first described by economists William Baumol and William Bowen in the 1960s. The core idea: when productivity surges in one part of the economy, wages rise across the whole economy, including in sectors where productivity hasn’t moved at all. A nurse still needs the same amount of time per patient. A plumber still has to be there in person. Their output doesn’t scale, but they still need to be paid competitively with everyone else.
The result is that the relative cost of hands-on, human-intensive work keeps rising, pulled upward by productivity gains happening around it. Healthcare, education, childcare, skilled trades. These are services people can’t simply stop using when prices climb. And most of them are funded or subsidized by governments already stretched thin.
Workers safe from AI displacement may find themselves in industries governments will increasingly struggle to fund, as the Baumol effect accelerates alongside AI-driven productivity gains everywhere else. This is Economics Explained’s extrapolation from the research, not a finding of the MIT paper itself, but it’s grounded in solid economic theory and worth taking seriously.
What This Means If You're Running a Small Business
Here’s where I want to get practical, because this study has a very direct message for small business owners, even if it never says it out loud.
The Iceberg Index reveals that AI’s most powerful effects are happening in exactly the kind of work small businesses do every day: document processing, data analysis, client communication drafts, financial summaries, research, and coordination. The work that fills your administrative hours. The work you either do yourself or pay someone to do.
- The financial analyst compressing a day's work into an hour? That's you, reviewing invoices and cash flow reports.
- The HR coordinator whose document processing is exposed? That's you, onboarding contractors and writing job descriptions.
- The legal secretary processing routine documents? That's you, drafting client contracts and proposals.
The people waiting to see how this plays out are the ones who will feel the gap most. The people already using AI to do administrative work faster, writing, summarizing, researching, processing, are quietly compressing their overhead while their competitors aren’t. That’s not a technology advantage. That’s a time advantage, and time is the one resource you can’t buy more of.
The MIT researchers built the Iceberg Index because the old tools couldn’t see the actual shape of the problem. Most people are navigating with a 30-year-old map. The question for you isn’t whether AI will change your industry. It already is. The question is whether you’ll be the one doing the compressing or the one being compressed.
You don't need a graduate degree in AI to benefit. You need to start. The tools are already here. The window to get ahead is still open, but it's not staying open forever.
A Quick Note on What the Study Doesn't Claim
The Iceberg Index is honest about its limits, and I want to be too. It measures where skill overlap exists right now, not what firms will do about it, how fast governments will respond, or which workers will successfully adapt. Transitions like this have historically created as many new roles as they disrupted. The transitions that went best were the ones where people could see what was coming clearly enough to prepare.
That’s all this post is trying to do. Give you a clearer map. The rest is yours to decide.
Learn AI That Actually Works for Your Business
Pro-How teaches small business owners how to put AI tools to work practically, without the hype, without the overwhelm.